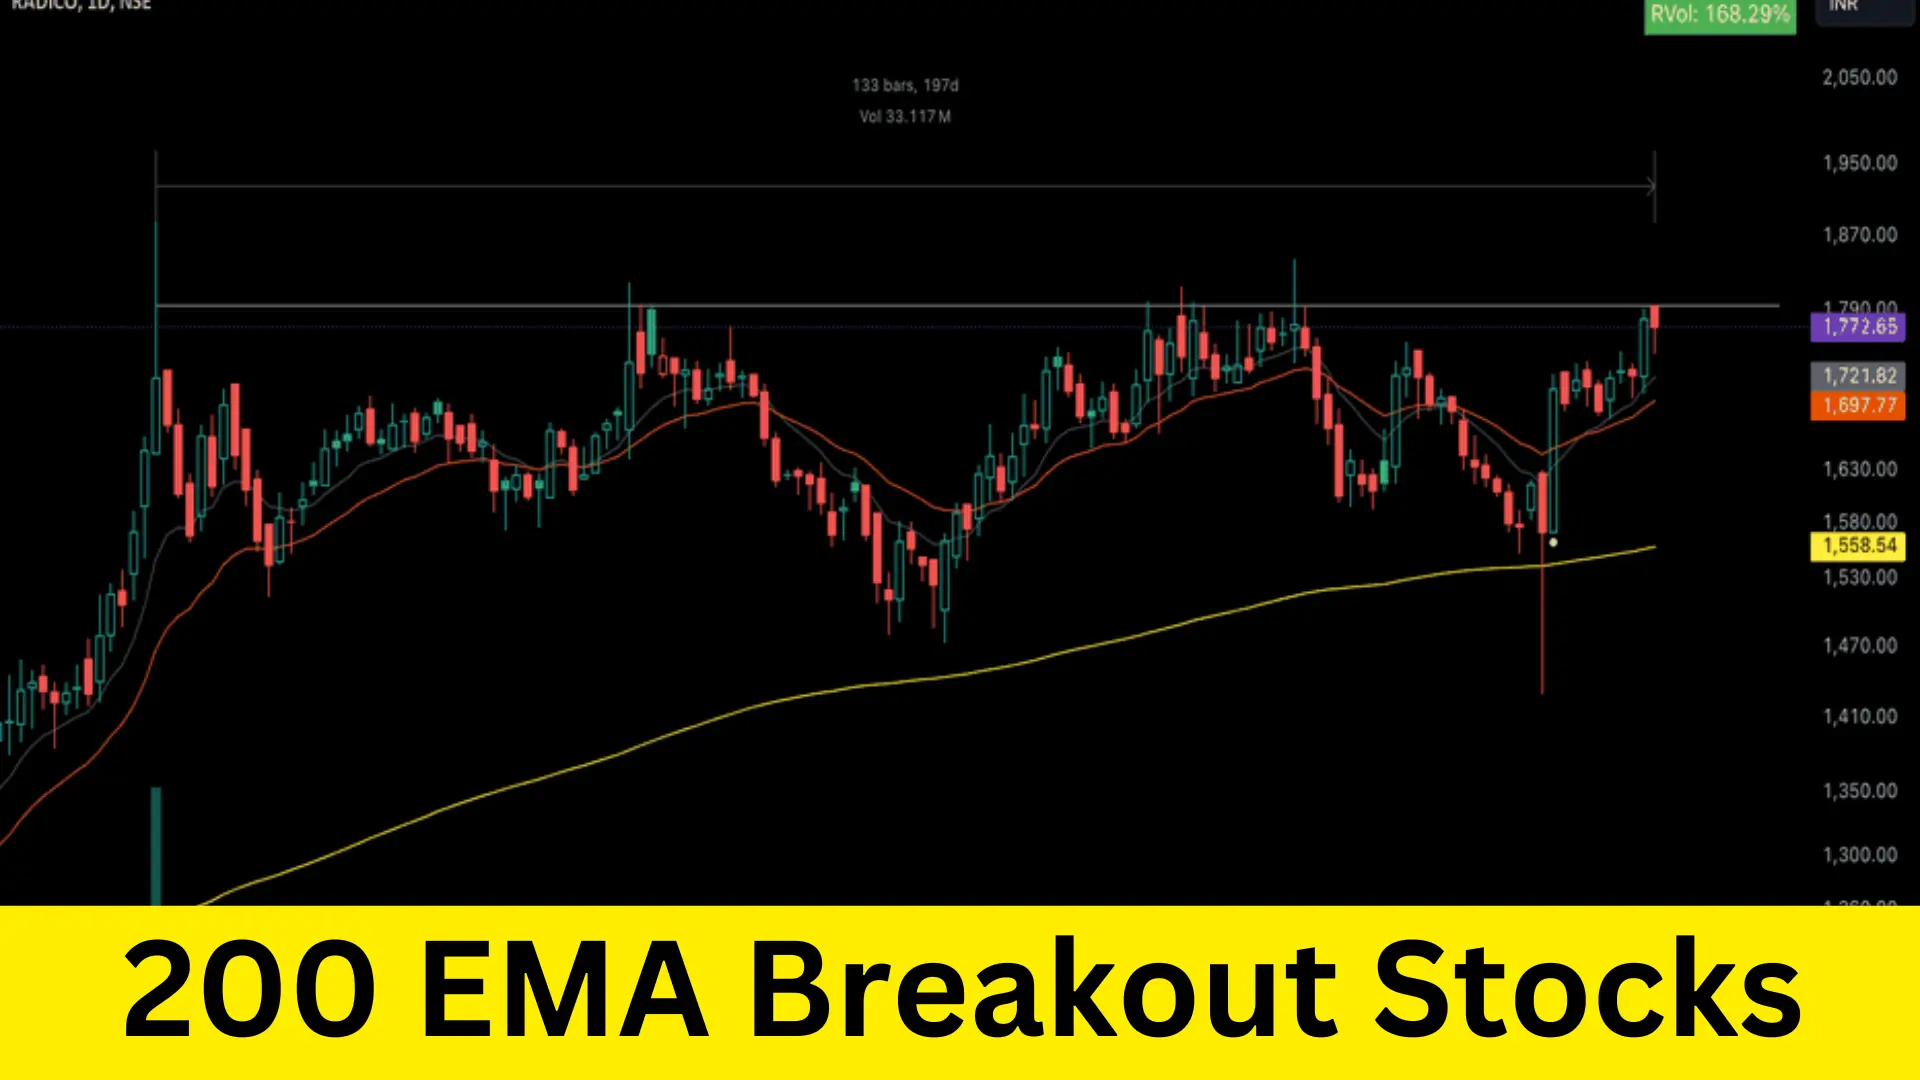
200 EMA Breakout Stocks

In the world of stock trading, 200 EMA breakout stocks have gained significant attention among traders and investors. The 200-day Exponential Moving Average (EMA) is a widely respected technical indicator used to identify the long-term trend of a stock. When a stock price breaks above the 200 EMA, it is often seen as a bullish signal, indicating potential upward momentum. This article delves into the intricacies of 200 EMA breakout stocks, offering detailed insights and strategies for maximizing your trading success.
Understanding the 200 EMA
The 200 EMA is a moving average that places more weight on recent prices, making it more responsive to new information compared to the simple moving average (SMA). It smooths out price data over 200 trading days, providing a clearer picture of the long-term trend.
Calculation of the 200 EMA
To calculate the 200 EMA, we use the following formula:
EMA=(Pt−EMApreviousK)+EMAprevious\text{EMA} = \left( \frac{P_t – EMA_{\text{previous}}}{K} \right) + EMA_{\text{previous}}
Where:
- PtP_t is the current price
- EMApreviousEMA_{\text{previous}} is the EMA of the previous day
- KK is the smoothing constant, calculated as 2n+1\frac{2}{n+1} where nn is the number of days
Why the 200 EMA is Important
The 200 EMA is crucial for several reasons:
- Trend Identification: It helps traders identify the long-term trend of a stock, filtering out short-term fluctuations.
- Support and Resistance: The 200 EMA often acts as a dynamic support or resistance level, influencing buying and selling decisions.
- Psychological Benchmark: Many traders and investors watch the 200 EMA, making it a self-fulfilling indicator.
Identifying 200 EMA Breakout Stocks
Criteria for a Breakout
To identify 200 EMA breakout stocks, we look for stocks that meet the following criteria:
- Price Breaks Above the 200 EMA: The stock price must close above the 200 EMA, indicating a potential shift in trend.
- Volume Confirmation: Increased trading volume on the breakout day adds credibility to the breakout.
- Positive Fundamental Indicators: Stocks with strong fundamentals are more likely to sustain a breakout.
Screening for 200 EMA Breakout Stocks
Using stock screening tools, we can filter stocks based on the 200 EMA breakout criteria. Platforms like Screener.in provide customizable screens to identify potential breakout candidates. Here’s how to set up a screen:
- Select Technical Indicators: Choose the 200 EMA as a key indicator.
- Set Breakout Conditions: Filter for stocks with prices above the 200 EMA.
- Add Volume Criteria: Include stocks with higher-than-average trading volume.
- Incorporate Fundamental Metrics: Screen for stocks with strong earnings, revenue growth, and low debt.
Trading Strategies for 200 EMA Breakout Stocks
Breakout Entry
Entering a trade at the breakout point is a common strategy. To optimize entry points:
- Wait for Confirmation: Ensure the stock closes above the 200 EMA on higher volume.
- Set Entry Orders: Place buy orders slightly above the breakout level to avoid false breakouts.
Stop-Loss and Risk Management
Effective risk management is crucial for successful trading. Consider these guidelines:
- Set Stop-Loss Orders: Place stop-loss orders just below the 200 EMA or recent swing lows to limit potential losses.
- Position Sizing: Determine the size of your position based on your risk tolerance and account size.
Profit Targets and Exit Strategies
Establishing profit targets and exit strategies is essential for maximizing gains:
- Partial Profits: Take partial profits at predefined levels to secure gains while leaving some position open for further upside.
- Trailing Stops: Use trailing stops to lock in profits as the stock price moves in your favor.
Case Studies: Successful 200 EMA Breakouts
Example 1: Stock XYZ
Stock XYZ broke above its 200 EMA on high volume, accompanied by strong earnings growth. The breakout was confirmed, and the stock continued to rise, providing substantial returns.
Example 2: Stock ABC
Stock ABC demonstrated a classic 200 EMA breakout, with significant volume and positive news. Traders who entered at the breakout and used trailing stops captured impressive gains as the stock surged.
Common Pitfalls and How to Avoid Them
False Breakouts
Not all breakouts are successful. To avoid false breakouts:
- Look for Confirmation: Wait for a close above the 200 EMA with high volume.
- Analyze Market Conditions: Ensure the overall market sentiment supports the breakout.
Overtrading
Overtrading can lead to unnecessary losses. To avoid this:
- Stick to Your Strategy: Follow your predefined criteria for breakouts.
- Be Patient: Wait for high-probability setups rather than chasing every potential breakout.
Conclusion
200 EMA breakout stocks offer exciting opportunities for traders and investors looking to capitalize on long-term trends. By understanding the significance of the 200 EMA, identifying breakout candidates, and employing effective trading strategies, we can enhance our chances of success in the stock market.


